


Contents
Scroll to:
 O. V. Prasolova,
N. I. Malik,
I. A. Timofeeva,
N. A. Kirsanova,
E. V. Krylova,
E. V. Malik,
I. A. Rusanov,
N. A. Chupakhina
O. V. Prasolova,
N. I. Malik,
I. A. Timofeeva,
N. A. Kirsanova,
E. V. Krylova,
E. V. Malik,
I. A. Rusanov,
N. A. Chupakhina https://doi.org/10.29326/2304-196X-2024-13-4-373-381
Scroll to:
The diversity of gut microbiota is an important ecological resource that plays a key role in maintenance of the host homeostasis. It is extremely important to preserve the existing gut microbiota diversity, which ensures its resistance to the negative effects of abiotic factors, while the study of the antibiotic role in the disturbance of microbiota diversity is a fundamental basis used not only to identify aspects responsible for microbiota-associated poultry diseases, but also to learn techniques of microbiota management. This study gives a characteristic of poultry gut microbiota diversity before and after antibiotic administration based on 16S rRNA gene sequencing analysis. Firmicutes and Bacteroidota species were predominantly detected in the chick microbiota during antibiotic administration and after its withdrawal. A significant increase in Patescibacteria abundance was observed on day 11 post enrofloxacin cessation. Actinobacteriota started appearing on day 11 after antibiotic discontinuation. An increase in Cyanobacteria abundance was detected on day 4 after the drug withdrawal. Taxonomic shifts in the chick microbial community structure at the class level both during the antibiotic treatment and after its withdrawal were observed. The abundance of Clostridia and Bacteroidia classes tended to decrease, while Bacilli class increased in its abundance, especially on day 8 after the drug withdrawal. It was found that a ten-day course of enrofloxacin treatment at the recommended doses leads to an increase in the abundance of Bacillaceae, Gastranaerophilales, Lactobacillaceae, Bacteroidaceae, Bifidobacteriaceae families, while the abundance of Rikenellaceae, Erysipelatoclostridiaceae, Clostridiaceae, Ruminococcaceae decreased and did not affect the abundance of Lachnospiraceae family. The revealed increase in the proportion of Lactobacillaceae during antibiotic treatment suggests the ability of a healthy organism to restore the microbiota balance. The results of metagenomic data bioinformatics (without truncation) showed the presence of 158 microorganism species in the chick microbiota, 38% of which were classified as nonculturable.
Prasolova O.V., Malik N.I., Timofeeva I.A., Kirsanova N.A., Krylova E.V., Malik E.V., Rusanov I.A., Chupakhina N.A. Metagenomic analysis of gut microbiota diversity in poultry before and after antibiotic administration. Veterinary Science Today. 2024;13(4):373-381. https://doi.org/10.29326/2304-196X-2024-13-4-373-381
Normal intestinal flora is a quantitative and qualitative relationship between diverse microbial populations within individual organs and systems, maintaining the biochemical, metabolic and immunological balance needed to preserve the animal health [1]. In recent years, the role of the intestinal microbiota in the disease development has been established in various animal species, including humans, dogs, pigs, cattle, poultry and fur animals [2-8]. The gastrointestinal tract of chickens is densely populated with complex microbial communities (bacteria, fungi, archaea, protozoa and viruses), dominated by bacteria [9][10]. Historically, selective culture techniques have been used to identify and characterize the microbial diversity of avian intestines. The novelty of this work is the use of bacterial 16S ribosomal RNA (rRNA) gene sequencing to study the poultry gut microbiota diversity before and after antibiotic treatment. Modern high-performance sequencing produce rapid data about microbial communities and is a powerful tool that brought an important novel understanding of the biological and ecological role of the intestinal microbiota [11-14].
The use of antibiotics in veterinary medicine can contribute to the development of antimicrobial resistance [15]. According to the criteria proposed by the World Organization for Animal Health (WOAH), antimicrobials are classified into three categories: Veterinary Critically Important Antimicrobial Agents (VCIA), Veterinary Highly Important Antimicrobial Agents (VHIA) and Veterinary Important Antimicrobial Agents (VIA). However, a specific antimicrobial drug/class can be considered critically important for the treatment of a specific disease. For a number of antimicrobials, there are no or few alternatives to treat a particular disease. Fluoroquinolones are often used in veterinary practice to treat infectious animal diseases. They are also included in the list of the WOAH critically important antimicrobials for human and animal health [16]. The study of the effect of fluoroquinolones on a healthy organism, that is, a normal microbiota, is relevant.
The aim of the work was to study the diversity of the poultry intestinal microbiota before and after antibiotic treatment using 16S rRNA gene sequencing.
The object of the study was the chick cecal microbiota.
The studies were conducted in 90 fifteen day-old Russian white layers from one batch, hatched from SPF eggs in the Manikhino hatchery with approximately the same live weight. The chicks were randomly divided into two groups (test and control), each was placed in a separate cage (5 chicks per cage). The chickens were kept in standard laboratory animal facility conditions, they were fed a standard diet and given water ad libitum.
The samples of the cecal contents from the test and control chicks were tested. The samples were collected immediately after killing by cervical dislocation on days 4, 8, 11 of antibiotic treatment and on days 4, 8, 11 after the drug cessation. The test chicks were individually given 1.0 mL of an antibiotic solution at a dose of 10.0 mg/kg of live weight using a probe. The drug was administered in the morning before feeding. Control chicks in parallel to test chicks were given 1.0 mL of water for injection. The antibiotic used was enrofloxacin (Enrovec 10% for injection, Vector, Russia, batch OE011021, 1.0 mL contains 100 mg of enrofloxacin) at the rate of 10.0 mg/kg of weight.
All procedures involving animals complied with the ethical standards adopted by the European Convention ETS No. 123.
DNA was isolated from the samples using QIAamp DNA Microbiome Kit (QIAGEN, Germany) according to the manufacturer’s recommendations. The quality of the extracted DNA was checked by electrophoresis in 0.8% agarose gel, as well as using the TapeStation 4200 system (Agilent Technologies, USA). The DNA concentration was measured using the Quantus fluorometer (Promega, USA). The DNA library was prepared according to the 16S Metagenomic Sequencing Library Preparation protocol using Nextera XT DNA Library Preparation Kit (Illumina, USA). MiSeq Reagent Kit v3 (Illumina, USA) was used for sequencing, which enables long read lengths (300 nucleotides).
QIIME2 software package was used to analyze the 16S rRNA sequencing data. For the initial processing of raw sequences, DADA2 package was used, which gives more reproducible and accurate results due to denoising algorithms, rather than clustering of phylotypes, in contrast to more classical approaches [17][18]. The taxonomic affiliation of phylotypes was determined using the RDP classifier based on SILVA [19]. The data were normalised using the rarefaction algorithm in the QIIME2 software while analyzing alpha diversity according to major recommendations of the developers, and were stabilised by variation through the Deseq2 package [20] to compare the relative abundances of phylotypes in the samples. For the analysis of beta diversity, communities were compared using the construction of their dissimilarity matrix using the weighted UniFrac, unweighted UniFrac and Bray-Curtis algorithms.
Statistical processing of the results was performed by analysis of variance using Microsoft Excel 2010 software. The results are presented as the arithmetic mean (M) and the standard error of the mean (± SEM). The reliability of the differences was determined by the Student’s t-test, the differences were considered statistically significant at p ≥ 0.95.
The bioinformatic analysis showed that the highest number of detected reads in the chick microbiome during the drug administration and after its withdrawal was produced by Firmicutes species. The second maximum observed number of OTUs (operational taxonomic unit) was assigned to Bacteroidota species. A significant increase in Patescibacteria number was observed on day 11 post enrofloxacin cessation. Actinobacteriota started appearing on day 11 after the antibiotic discontinuation. An increase in Cyanobacteria abundance was detected on day 4 after the drug withdrawal (Fig. 1, Table 1).
Taxonomic shifts in the chick microbial community structure at the species level both during the antibiotic treatment and after its withdrawal were observed. The abundance of Clostridia and Bacteroidia representatives tended to decrease, while Bacilli species increased in its abundance, especially on day 8 after the drug withdrawal (Fig. 2, Table 2).
The change in the number of reads at the level of orders is consistent with the changes at the family level (Fig. 3, Table 3).
A ten-day course of enrofloxacin treatment at the recommended doses leads to an increase in the abundance of Bacillaceae, Gastranaerophilales, Lactobacillaceae, Bacteroidaceae, Bifidobacteriaceae families, while the abundance of Rikenellaceae, Erysipelatoclostridiaceae, Clostridiaceae, Ruminococcaceae decreased and did not affect the abundance of Lachnospiraceae family.
Of the 28 genera detected in the microbiome of test and control chicks, two genera belonging to families Oscillospiraceae and Ruminococcaceae could not be classified. The abundance of Lactobacillus, Akkermansia, Blautia, Candidatus Saccharimonas genera was significantly greater during the period of enrofloxacin administration and after its withdrawal, while Faecalibacterium, Lachnoclostridium, Ruminococcus abundance was reduced (Table 4, Fig. 4).
The results of metagenomic data bioinformatic analysis (without truncation) showed the presence of 158 microorganism species in the chick microbiota, 38% of which were classified as nonculturable.
The analysis of the beta diversity of the metagenomic community under study showed changes in the taxonomic diversity of microbiomes in the test and control chicks (Fig. 5A). The changes were expressed as an expansion in the taxonomic community composition within the groups (Fig. 5B).
Significant differences characterizing alpha diversity were found over time only within the groups, but not relative to each other at a specific time point. The most significant difference in alpha diversity was demonstrated for samples at point 19, corresponding to day 8 after the antibiotic cessation (Fig. 6).
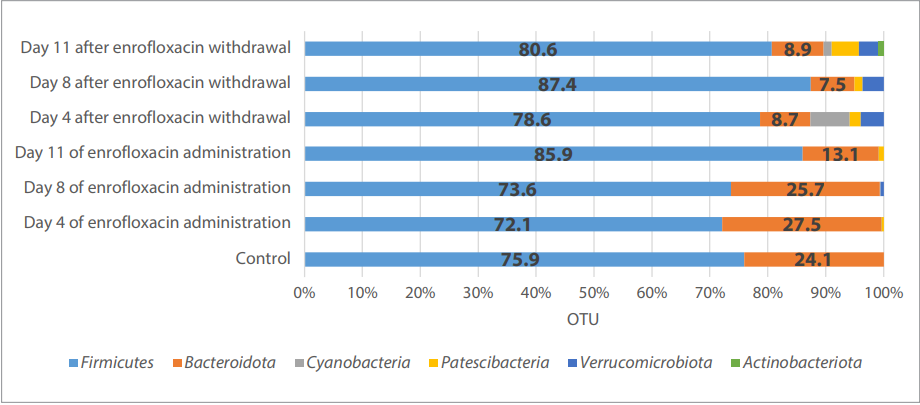
Fig. 1. Phylogenetic profile of the chick microbiome at the species level
Table 1
The cecal microflora composition at the bacterial species level demonstrated by 16S rRNA gene amplicon NGS-sequencing
|
Species |
Control, % |
Day 4 of enrofloxacin administration, % |
Day 8 of enrofloxacin administration, % |
Day 11 of enrofloxacin administration, % |
Day 4 |
Day 8 |
Day 11 |
|
Firmicutes |
75.9 ± 4.6 |
72.1 ± 10.6 |
73.6 ± 9.9 |
85.9 ± 2.5 |
78.6 ± 7.4 |
87.4 ± 7.2 |
80.6 ± 4.4 |
|
Bacteroidota |
24.1 ± 4.6 |
27.5 ± 10.7 |
25.7 ± 9.5 |
13.1 ± 2.1 |
8.7 ± 1.8 |
7.5 ± 4.4 |
8.9 ± 2.2 |
|
Cyanobacteria |
– |
0.01 ± 0.01 |
0.08 ± 0.05 |
0.01 ± 0.01 |
6.8 ± 6.2 |
– |
1.4 ± 0.7 |
|
Patescibacteria |
– |
0.4 ± 0.4 |
– |
0.9 ± 0.6 |
1.9 ± 1.8 |
1.4 ± 0.7 |
4.7 ± 2.6 |
|
Verrucomicrobiota |
– |
– |
0.6 ± 0.6 |
– |
4.0 ± 2.2 |
3.7 ± 2.9 |
3.3 ± 2.8 |
|
Actinobacteriota |
– |
– |
– |
– |
– |
– |
1.0 ± 0.5 |
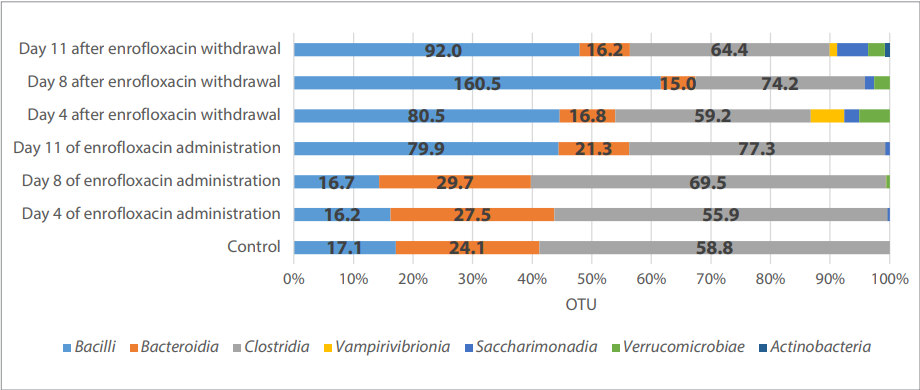
Fig. 2. Phylogenetic profile of the chick microbiome at the class level
Table 2
The cecal microflora composition at the bacterial class level demonstrated by 16S rRNA gene amplicon NGS-sequencing
|
Class |
Control, % |
Day 4 of enrofloxacin administration, % |
Day 8 of enrofloxacin administration, % |
Day 11 of enrofloxacin administration, % |
Day 4 after enrofloxacin withdrawal, |
Day 8 after enrofloxacin withdrawal, |
Day 11 |
|
Bacilli |
17.1 ± 6.3 |
16.2 ± 6.3 |
16.7 ± 5.5 |
79.9 ± 35.9 |
80.5 ± 23.6 |
160.5 ± 32.9 |
92.0 ± 17.2 |
|
Bacteroidia |
24.1 ± 4.6 |
27.5 ± 10.7 |
29.7 ± 10.9 |
21.3 ± 2.0 |
16.8 ± 4.9 |
15.0 ± 6.6 |
16.2 ± 2.9 |
|
Clostridia |
58.8 ± 5.2 |
55.9 ± 7.0 |
69.5 ± 11.3 |
77.3 ± 2.8 |
59.2 ± 14.1 |
74.2 ± 11.0 |
64.4 ± 7.3 |
|
Vampirivibrionia |
– |
0.01 ± 0.01 |
0.1 ± 0.06 |
0.02 ± 0.02 |
10.2 ± 8.7 |
– |
2.4 ± 1.2 |
|
Saccharimonadia |
– |
0.4 ± 0.4 |
– |
1.4 ± 1.0 |
4.5 ± 4.2 |
4.1 ± 2.0 |
10.0 ± 5.6 |
|
Verrucomicrobiae |
– |
– |
0.7 ± 0.7 |
– |
9.3 ± 5.3 |
6.8 ± 4.8 |
5.4 ± 4.4 |
|
Actinobacteria |
– |
– |
– |
– |
– |
– |
1.6 ± 0.8 |
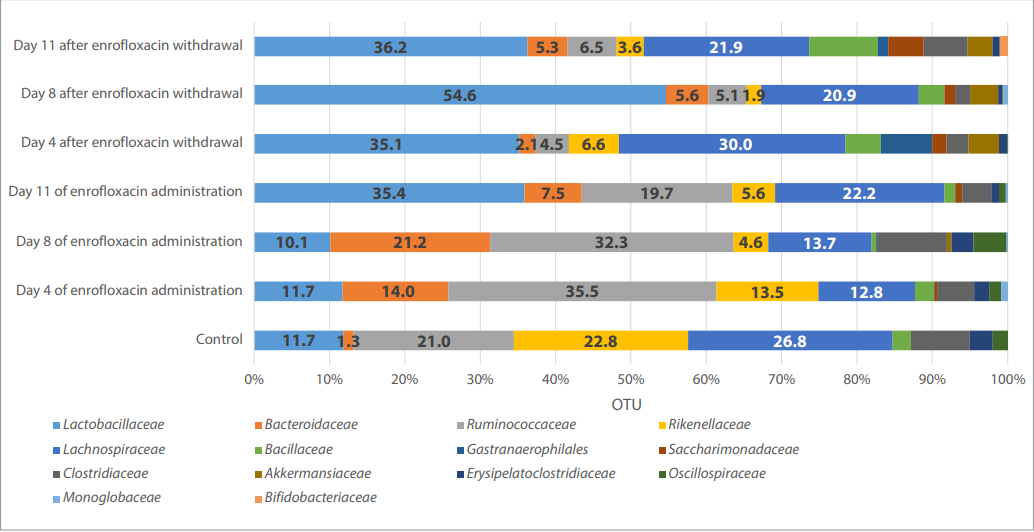
Fig. 3. Phylogenetic profile of the chick microbiome at the family level
Table 3
The cecal microflora composition at the bacterial family level demonstrated by 16S rRNA gene amplicon NGS-sequencing
|
Family |
Control, % reed ± SEM |
Day 4 of enrofloxacin administration, % reed ± SEM |
Day 8 of enrofloxacin administration, % reed ± SEM |
Day 11 of enrofloxacin administration, % reed ± SEM |
Day 4 after enrofloxacin withdrawal, % reed ±SEM |
Day 8 after enrofloxacin withdrawal, % reed ± SEM |
Day 11 after enrofloxacin withdrawal, % reed ± SEM |
|
Lactobacillaceae |
11.7 ± 6.7 |
11.7 ± 6.3 |
10.1 ± 4.0 |
35.4 ± 8.2 |
35.1 ± 7.1 |
54.6 ± 5.4 |
36.2 ± 6.1 |
|
Bacteroidaceae |
1.3 ± 1.1 |
14.0 ± 8.2 |
21.2 ± 8.0 |
7.5 ± 2.0 |
2.1 ± 0.6 |
5.6 ± 3.6 |
5.3 ± 0.6 |
|
Ruminococcaceae |
21.0 ± 3.6 |
35.5 ± 7.1 |
32.3 ± 8.2 |
19.7 ± 5.2 |
4.5 ± 2.2 |
5.1 ± 1.7 |
6.5 ± 2.4 |
|
Rikenellaceae |
22.8 ± 5.0 |
13.5 ± 3.1 |
4.6 ± 1.8 |
5.6 ± 1.7 |
6.6 ± 1.6 |
1.9 ± 0.9 |
3.6 ± 2.0 |
|
Lachnospiraceae |
26.8 ± 2.7 |
12.8 ± 1.1 |
13.7 ± 3.5 |
22.2 ± 5.3 |
30.0 ± 8.8 |
20.9 ± 3.3 |
21.9 ± 3.4 |
|
Bacillaceae |
2.4 ± 0.8 |
2.5 ± 0.8 |
0.6 ± 0.4 |
1.4 ± 0.8 |
4.7 ± 1.0 |
3.4 ± 0.6 |
9.1 ± 3.1 |
|
Gastranaerophilales |
– |
0.01 ± 0.01 |
0.1 ± 0.05 |
0.01 ± 0.01 |
6.8 ± 6.16 |
– |
1.4 ± 0.7 |
|
Saccharimonadaceae |
– |
0.4 ± 0.4 |
– |
0.9 ± 0.6 |
1.9 ± 1.8 |
1.4 ± 0.7 |
4.7 ± 2.6 |
|
Clostridiaceae |
7.7 ± 2.0 |
4.9 ± 0.9 |
9.3 ± 4.9 |
3.8 ± 1.4 |
2.9 ± 2.3 |
2.0 ± 1.0 |
5.8 ± 1.9 |
|
Akkermansiaceae |
– |
– |
0.6 ± 0.6 |
– |
4.04 ± 2.2 |
3.7 ± 2.9 |
3.3 ± 2.8 |
|
Erysipelatoclostridiaceae |
3.0 ± 0.8 |
2.0 ± 0.9 |
2.9 ± 0.9 |
1.0 ± 0.4 |
1.1 ± 0.5 |
0.6 ± 0.1 |
0.9 ± 0.4 |
|
Oscillospiraceae |
2.0 ± 1.0 |
1.6 ± 0.5 |
4.4 ± 1.4 |
0.9 ± 0.4 |
0.1 ± 0.1 |
0.1 ± 0.07 |
0.1 ± 0.1 |
|
Monoglobaceae |
– |
0.9 ± 0.4 |
0.2 ± 0.1 |
0.3 ± 0.2 |
0.01 ± 0.01 |
0.62 ± 0.49 |
0.05 ± 0.05 |
|
Bifidobacteriaceae |
– |
– |
– |
– |
– |
– |
1.0 ± 0.5 |
Table 4
The cecal microflora composition at the bacterial genus level demonstrated by 16S rRNA gene amplicon NGS-sequencing
|
Genus |
Control, % reed ± SEM |
Day 4 of enrofloxacin administration, % reed ± SEM |
Day 8 of enrofloxacin administra- |
Day 11 of enrofloxacin administra- |
Day 4 after enrofloxacin withdrawal, % reed ± SEM |
Day 8 after enrofloxacin withdrawal, % reed ± SEM |
Day 11 after enrofloxacin withdrawal, % reed ± SEM |
|
Lactobacillus |
11.7 ± 6.7 |
11.7 ± 6.3 |
10.08 ± 3.97 |
35.39 ± 8.19 |
35.13 ± 7.07 |
54.59 ± 5.43 |
36.16 ± 6.08 |
|
Bacteroides |
1.3 ± 1.1 |
14.0 ± 8.2 |
21.16 ± 8.0 |
7.54 ± 2.04 |
2.08 ± 0.64 |
5.58 ± 3.56 |
5.32 ± 0.61 |
|
Faecalibacterium |
11.3 ± 2.8 |
25.4 ± 5.2 |
24.18 ± 7.75 |
9.48 ± 4.06 |
1.51 ± 0.44 |
1.02 ± 0.31 |
0.90 ± 0.46 |
|
Alistipes |
22.8 ± 5.0 |
13.5 ± 3.1 |
4.56 ± 1.85 |
5.61 ± 1.7 |
6.59 ± 1.64 |
1.95 ± 0.87 |
3.63 ± 2.0 |
|
Subdoligranulum |
1.0 ± 0.9 |
0.2 ± 0.1 |
1.75 ± 1.25 |
3.62 ± 2.46 |
2.26 ± 2.09 |
3.31 ± 1.85 |
5.37 ± 2.0 |
|
Ruminococcus |
12.6 ± 1.7 |
3.6 ± 0.3 |
3.15 ± 0.56 |
5.29 ± 2.57 |
4.15 ± 2.16 |
2.30 ± 0.56 |
2.60 ± 0.64 |
|
Blautia |
0.4 ± 0.2 |
0.3 ± 0.3 |
0.41 ± 0.25 |
1.12 ± 0.68 |
2.05 ± 0.68 |
3.51 ± 1.0 |
6.52 ± 1.14 |
|
Bacillus |
2.4 ± 08 |
2.5 ± 0.8 |
0.60 ± 0.36 |
1.36 ± 0.80 |
4.73 ± 0.96 |
3.41 ± 0.65 |
9.09 ± 3.12 |
|
Lachnospira |
9.7 ± 0.7 |
6.0 ± 0.8 |
6.50 ± 1.38 |
12.74 ± 3.76 |
15.59 ± 5.17 |
9.59 ± 1.5 |
6.25 ± 1.55 |
|
Ruminococcus |
2.9 ± 0.8 |
2.7 ± 1.4 |
3.57 ± 1.28 |
2.66 ± 0.65 |
0.21 ± 0.08 |
0.06 ± 0.04 |
0.05 ± 0.05 |
|
Gastranaerophilales |
0.0 ± 0.0 |
0.0 ± 0.0 |
0.08 ± 0.05 |
0.01 ± 0.01 |
6.82 ± 6.16 |
0.00 ± 0.0 |
1.43 ± 0.74 |
|
Candidatus saccharimonas |
0.0 ± 0.0 |
0.4 ± 0.4 |
0.00 ± 0.0 |
0.90 ± 0.62 |
1.89 ± 1.77 |
1.41 ± 0.66 |
4.70 ± 2.56 |
|
Clostridium |
7.7 ± 2.0 |
4.9 ± 0.9 |
9.29 ± 4.89 |
3.79 ± 1.38 |
2.94 ± 2.28 |
2.03 ± 0.95 |
5.83 ± 1.95 |
|
Akkermansia |
0.0 ± 0.0 |
0.0 ± 0.0 |
0.62 ± 0.62 |
0.00 ± 0.0 |
4.04 ± 2.2 |
3.65 ± 2.93 |
3.30 ± 2.81 |
|
Erysipelatoclostridium |
3.0 ± 0.8 |
2.0 ± 0.9 |
2.88 ± 0.94 |
0.96 ± 0.37 |
1.06 ± 0.46 |
0.59 ± 0.1 |
0.93 ± 0.37 |
|
Lachnoclostridium |
2.1 ± 0.2 |
2.0 ± 0.3 |
2.29 ± 1.51 |
2.08 ± 0.71 |
1.22 ± 0.43 |
1.23 ± 0.34 |
0.81 ± 0.18 |
|
Sellimonas |
1.8 ± 0.5 |
0.8 ± 0.3 |
1.21 ± 0.33 |
0.77 ± 0.29 |
3.32 ± 1.23 |
2.37 ± 1.18 |
1.75 ± 0.36 |
|
Ruminococcus |
1.1 ± 0.5 |
1.0 ± 0.6 |
0.58 ± 0.24 |
2.45 ± 0.95 |
0.25 ± 0.13 |
0.00 ± 0.0 |
0.05 ± 0.05 |
|
Eubacterium hallii group |
0.2 ± 0.1 |
0.0 ± 0.0 |
0.17 ± 0.07 |
0.19 ± 0.07 |
3.52 ± 1.48 |
1.45 ± 0.47 |
0.69 ± 0.27 |
|
CHKCI001 |
0.0 ± 0.0 |
0.0 ± 0.0 |
0.02 ± 0.01 |
0.02 ± 0.02 |
0.20 ± 0.1 |
0.48 ± 0.27 |
3.28 ± 1.89 |
|
Unclassified Oscillospiraceae |
1.0 ± 0.5 |
0.7 ± 0.2 |
2.58 ± 0.99 |
0.92 ± 0.45 |
0.13 ± 0.06 |
0.08 ± 0.04 |
0.07 ± 0.05 |
|
Unclassified Ruminococcaceae |
2.8 ± 0.8 |
3.8 ± 1.0 |
0.38 ± 0.24 |
0.00 ± 0.0 |
0.07 ± 0.07 |
0.36 ± 0.3 |
0.03 ± 0.03 |
|
Eubacterium coprostanoligenes group |
1.0 ± 0.6 |
0.3 ± 0.3 |
0.09 ± 0.06 |
1.35 ± 0.99 |
0.00 ± 0.0 |
0.01 ± 0.01 |
0.05 ± 0.03 |
|
DTU089 |
0.8 ± 0.2 |
1.3 ± 0.2 |
0.39 ± 0.13 |
1.01 ± 0.34 |
0.24 ± 0.09 |
0.38 ± 0.17 |
0.15 ± 0.07 |
|
Unclassified Ruminococcaceae |
1.3 ± 0.6 |
1.1 ± 0.5 |
1.49 ± 0.91 |
0.44 ± 0.32 |
0.00 ± 0.0 |
0.00 ± 0.0 |
0.00 ± 0.0 |
|
Monoglobus |
0.3 ± 0.2 |
0.9 ± 0.4 |
0.17 ± 0.11 |
0.32 ± 0.25 |
0.01 ± 0.01 |
0.62 ± 0.49 |
0.05 ± 0.05 |
|
UCG-005 |
1.0 ± 0.5 |
1.0 ± 0.3 |
1.81 ± 1.32 |
0.00 ± 0.0 |
0.00 ± 0.0 |
0.03 ± 0.03 |
0.00 ± 0.0 |
|
Bifidobacterium |
0.0 ± 0.0 |
0.0 ± 0.0 |
0.00 ± 0.0 |
0.00 ± 0.0 |
0.00 ± 0.0 |
0.00 ± 0.0 |
1.00 ± 0.51 |
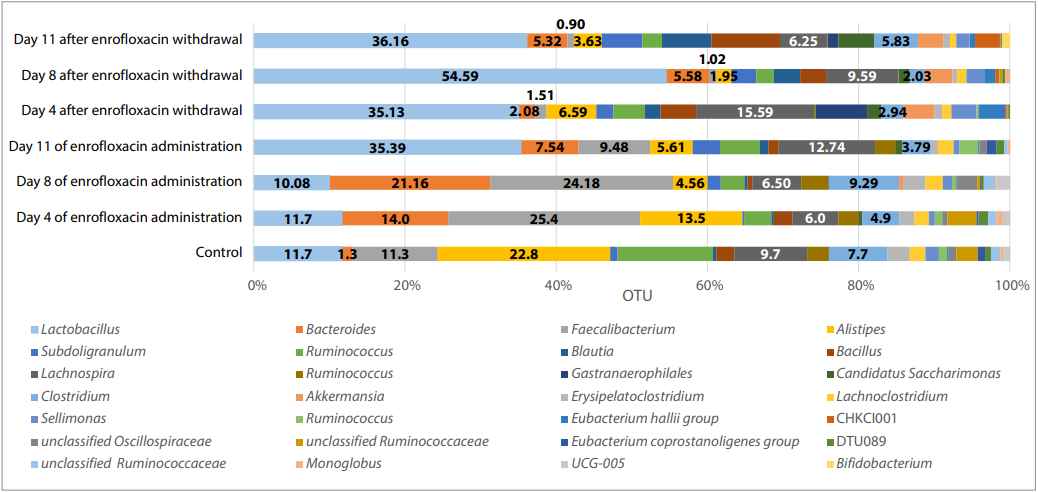
Fig. 4. Phylogenetic profile of the chick microbiome at the genus level
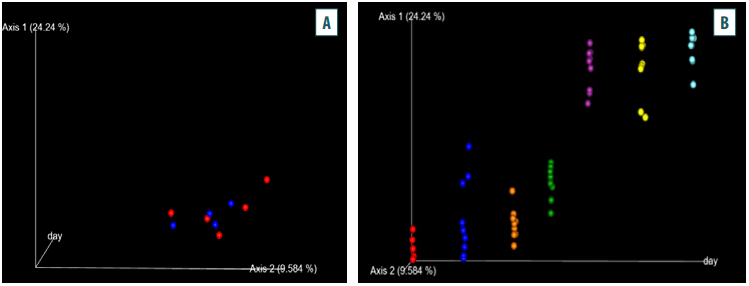
Fig. 5. A – changes in the beta diversity of the metagenomic community in the test (red) and control (blue) groups; B – changes in the beta diversity of the metagenomic community within the groups (red – control, blue – test, orange – day 4 of administration, green – day 8 of administration, purple – day 11 of administration)
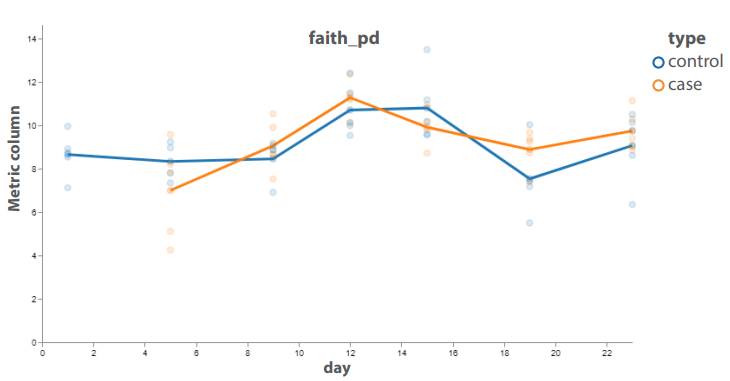
Fig. 6. Changes in the alpha diversity of the metagenomic community (blue – control, orange – test)
The change in the metagenomic taxonomy of the cecal microbiota of healthy chicks when using enrofloxacin antibiotic was analyzed. The most pronounced relative changes in the metagenomic taxonomy were recorded on day 8 after the start of the ten-day enrofloxacin administratopn course and on day 8 after its with-
drawal.
The analysis of metagenome sequencing data revealed the presence of a significant number of nonculturable microorganisms that cannot be detected by microbiological techniques.
1. Prasolova O. V., Malik N. I., Soltynskaya I. V., Bogomazova A. N., Krylova E. V., Malik E. V. Modern molecular genetic technologies for forming a list of representatives normal bird microflora. International Bulletin of Veterinary Medicine. 2022; (4): 203–210. https://doi.org/10.52419/issn20722419.2022.4.203 (in Russ.)
2. Shariff S., Kwan Su Huey A., Parag Soni N., Yahia A., Hammoud D., Nazir A., et al. Unlocking the gut-heart axis: exploring the role of gut microbiota in cardiovascular health and disease. Annals of Medicine and Surgery. 2024; 86 (5): 2752–2758. https://doi.org/10.1097/ms9.0000000000001744
3. Long C.-X., Wu J.-Q., Tan Z.-J. Intestinal microbiota disturbance affects the occurrence of African swine fever. Animal Biotechnology. 2023; 34 (4): 1040–1049. https://doi.org/10.1080/10495398.2021.2010089
4. Salazar Mazamba M. de L., Cushicóndor-Collaguazo D. M., ParraGuayasamin S. G., Coello-Peralta R. D. The role of the intestinal microbiota in the health and disease of dogs and its importance in the agricultural sector. Centrosur Agraria. 2023; 1 (18): 99–109. https://centrosuragraria.com/index. php/revista/article/view/244
5. Mosa M. I., Salem H. M., Bastami M. A., Amer M. M. Pathogenic and non-pathogenic factors; especially infectious bursal disease viruses; affect chicken digestive system microbiota and methods of its evaluation and recovery: a review. Egyptian Journal of Veterinary Science. 2023; 54 (4): 733–760. https://doi.org/10.21608/EJVS.2023.203480.1476
6. Kuznetsov Yu. Ye. Parasitic diseases of fur animals in the farms of the North Western region of the Russian Federation (control measures and prevention): Author’s thesis for degree of Dr. Sci. (Veterinary Medicine). Saint Petersburg; 2020. 496 p. (in Russ.)
7. Ilyina L. A. Microbiota of livestock, its association with health and productivity: Author’s thesis for degree of Dr. Sci. (Biology). Podolsk; 2022. 365 p. (in Russ.)
8. Podobed L. I., Kochish I. I., Karpenko L. Yu., Nikonov I. N., Bakhta A. A., Balykina A. B., Ryazanov I. G. Feeding of farm poultry. Part 2. Rapid diagnosis of feeding violations in poultry production and their prevention: study guide. Saint Petersburg; Saint-Petersburg State University of Veterinary Medicine; 2023. 228 p. (in Russ.)
9. Wei S., Morrison M., Yu Z. Bacterial census of poultry intestinal microbiome. Poultry Science. 2013; 92 (3): 671–683. https://doi.org/10.3382/ps.2012-02822
10. Shang Y., Kumar S., Oakley B., Kim W. K. Chicken gut microbiota: Importance and detection technology. Frontiers in Veterinary Science. 2018; 5:254. https://doi.org/10.3389/fvets.2018.00254
11. Laptev G. Yu., Yildirim E. A., Ilyina L. A. Geneticheskie metody izucheniya raznoobraziya i funktsii mikrobiomov dlya uluchsheniya zdorov’ya i povysheniya produktivnosti = Genetic methods of microbiots diversity and function study to improve health and increase productivity. Ekonomicheski i sotsial’no znachimye infektsii sel’skokhozyaistvennykh zhivotnykh: mery profilaktiki i bor’by: materialy Mezhdunarodnoi nauchno-prakticheskoi konferentsii (Moskva, 15 dekabrya 2022 g.) = Economically and socially significant infections of livestock: prevention and control measures: proceedings of the International Scientific and Practical Conference (Moscow, December 15, 2022). Moscow: Sel’skokhozyaistvennye tekhnologii; 2022; 128–135. https://elibrary.ru/gqnapj (in Russ.)
12. Lu X., Gong G., Zhang Q., Yang S., Wu H., Zhao M., et al. Metagenomic analysis reveals high diversity of gut viromes in yaks (Bos grunniens) from the Qinghai-Tibet Plateau. Communications Biology. 2024; 7:1097. https:// doi.org/10.1038/s42003-024-06798-y
13. Schmartz G. P., Rehner J., Schuff M. J., Molano L.-A. G., Becker S. L., Krawczyk M. et al. Exploring microbial diversity and biosynthetic potential in zoo and wildlife animal microbiomes. Nature Communications. 2024; 15:8263. https://doi.org/10.1038/s41467-024-52669-9
14. Prasolova O. V. Metagenomic analysis of microbiota taxonomy of young layers’ colon during their growth when using the antibiotic and after its withdrawal. Certifi te of state registration of a database No. 2024621987 Russian Federation. The All-Russian State Center for Quality and Standardization of Veterinary Drugs and Feed. No. 2024621650. Date of filing: 30.04.2024. Date of publication: 08.05.2024. Bull. No. 5. https://elibrary.ru/oxegnv (in Russ.)
15. Caneschi A., Bardhi A., Barbarossa A., Zaghini A. The use of antibiotics and antimicrobial resistance in veterinary medicine, a complex phenomenon: A narrative review. Antibiotics. 2023; 12 (3):487. https://doi.org/10.3390/antibiotics12030487
16. World Organisation for Animal Health. OIE List of Antimicrobial Agents of Veterinary Importance (June 2021). https://www.woah.org/app/uploads/2021/06/a-oie-list-antimicrobials-june2021.pdf (date of access: 06.03.2024).
17. Bolyen E., Rideout J. R., Dillon M. R., Bokulich N. A., Abnet C. C., Al-Ghalith G. A., et al. Reproducible, interactive, scalable and extensible microbiome data science using QIIME 2. Nature Biotechnology. 2019; 37 (8): 852–857. https://doi.org/10.1038/s41587-019-0209-9
18. Nearing J. T., Douglas G. M., Comeau A. M., Langille M. G. I. Denoising the denoisers: an independent evaluation of microbiome sequence error-correction approaches. PeerJ. 2018; 6:e5364. https://doi.org/10.7717/peerj.5364
19. Quast C., Pruesse E., Yilmaz P., Gerken J., Schweer T., Yarza P. et al. The SILVA ribosomal RNA gene database project: improved data processing and web-based tools. Nucleic Acids Research. 2013; 41 (D1): D590–596. https://doi.org/10.1093/nar/gks1219
20. Love M. I., Huber W., Anders S. Moderated estimation of fold change and dispersion for RNA-seq data with DESeq2. Genome Biology. 2014; 15 (12):550. https://doi.org/10.1186/s13059-014-0550-8
Olga V. Prasolova, Cand. Sci. (Veterinary Medicine), Leading Researcher, Department of Molecular Biology
5 Zvenigorodskoye shosse, Moscow 123022, Russia
Nina I. Malik, Dr. Sci. (Biology), Professor, Chief Researcher, Department of Scientific Planning
5 Zvenigorodskoye shosse, Moscow 123022, Russia
Irina A. Timofeeva, Researcher, Department of Molecular Biology
5 Zvenigorodskoye shosse, Moscow 123022, Russia
Natalya A. Kirsanova, Researcher, Department of Molecular Biology
5 Zvenigorodskoye shosse, Moscow 123022, Russia
Ekaterina V. Krylova, Cand. Sci. (Biology), Leading Researcher, Department of Molecular Biology
5 Zvenigorodskoye shosse, Moscow 123022, Russia
Evgeny V. Malik, Cand. Sci. (Veterinary Medicine), Leading Researcher, Department of Scientifi Planning
5 Zvenigorodskoye shosse, Moscow 123022, Russia
Ivan A. Rusanov, Senior Researcher, Scientific and Technological Laboratory
5 Zvenigorodskoye shosse, Moscow 123022, Russia
Nataliya A. Chupakhina, Cand. Sci. (Biology), Leading Researcher, Department of Bacteriology
5 Zvenigorodskoye shosse, Moscow 123022, Russia
Prasolova O.V., Malik N.I., Timofeeva I.A., Kirsanova N.A., Krylova E.V., Malik E.V., Rusanov I.A., Chupakhina N.A. Metagenomic analysis of gut microbiota diversity in poultry before and after antibiotic administration. Veterinary Science Today. 2024;13(4):373-381. https://doi.org/10.29326/2304-196X-2024-13-4-373-381
600901, Vladimir Oblast, Vladimir, microraion Yur’evets, ulitsa Gvardeyskaya, 6
FGBI “ARRIAH”
tel.: 8 (4922) 26-15-12, add. 22-27
E-mail: nikeshina@arriah.ru


